The site comprises ‘portals’ to access three areas with demonstration machine learning prediction / simulation / modelling tools for decision makers.:
- The CLINICAL INTELLIGENCE PORTAL simulates an AI enabled clinical agent that sits on top of an EHR’ and enabling clinicians to assess individual patients without needing to access this information through an EHR.
The Portal offers a selection of conditions for which clinical decisions can be modelled using the synthetic patients in the simulated EHR to explore various patient scenarios. - The MEDICINES INTELLIGENCE PORTAL offers access to a range of applications relevant to industry or business decision making on medicines or business decision making
- The COGNITIVE INTELLIGENCEPORTAL offers access to a range of prediction models of medical reasoning and clinical behaviours.
Information about the clinical portal prediction tools is provided below.
The other two portals include that information when you make a choice.
Information on these is protected and you should review the section on copyright and intellectual property under the investor tab.
This section also includes information if you wish to have a commercial or clinical discussions.
Please feel free to get in touch if you want more information.
NOTES on clinical prediction models
The clinical prediction models operate within a simulated EHR environment. Below, I’ve provided notes on each for reference.
Medication Vulnerability / Pharmacovigilance
Medication Associated Vulnerability Surveillance (MAV) is a clinical decision-support application designed to identify whether a patient’s current medicines may be contributing to a changing pattern of physiological or clinical vulnerability. Rather than focusing on a single adverse event, MAV allows the clinician to specify the clinical concern being monitored, such as heat vulnerability, hypotension, cognitive change, impaired mobility or another medication-sensitive outcome.
The application combines information about the patient, their medicines and relevant physiological observations to estimate how vulnerability may be changing over time. Where longitudinal monitoring data are available, the model can use changes in variables such as heart rate, respiratory rate, blood pressure, oxygen saturation and temperature to support personalised assessment over a short prediction horizon, typically 24–48 hours.
MAV is intended to distinguish medication-associated vulnerability from background clinical risk. It therefore asks not simply whether a patient is at risk, but whether one or more medicines, combinations of medicines or changes in treatment may plausibly be increasing that risk. The clinician can inspect the contributing factors, compare alternative scenarios and consider whether additional observation, medication review or another clinical response may be warranted.
The version presented here is a demonstrator using synthetic patient data. It illustrates the proposed surveillance and reasoning framework rather than providing validated clinical advice. In a deployed system, MAV would operate alongside clinical judgement, prescribing information, patient history and appropriate monitoring data; it is not intended to replace diagnosis or professional decision-making.
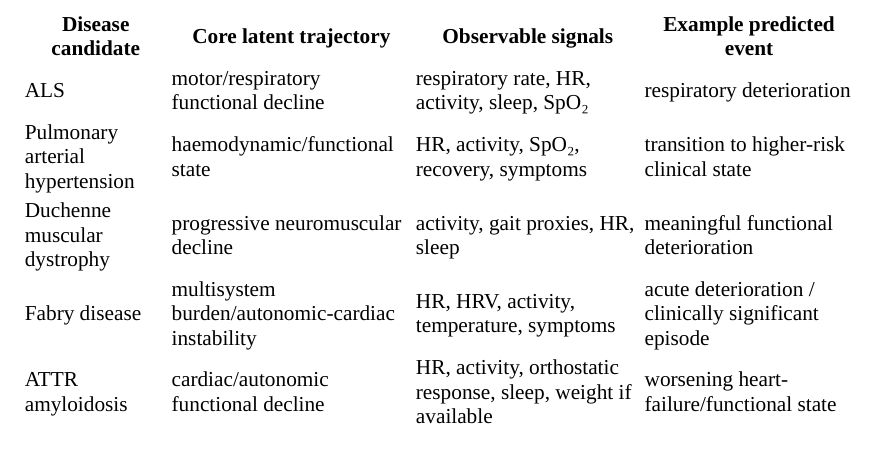
Rare Disease Trajectory
This predictor addresses the problem that rare-disease patients are often assessed intermittently, while clinically important deterioration develops continuously between visits.
The model combines sparse disease knowledge with each patient’s longitudinal physiological data to estimate where they are on their disease trajectory now, forecast plausible near-term futures, and identify when the risk of a meaningful clinical event is rising early enough to act.
Acute Coronary Syndrome
The Acute Coronary Instability Predictor (ACIP) is designed as a short-horizon early- warning tool for patients at high risk of acute coronary events.
ACIP focuses on detecting emerging instability in the 24–48 hour window, where vital signs, rhythm and autonomic patterning may deviate from a person’s usual baseline.
Target patients include:
- Adults with known coronary artery disease (CAD) or prior myocardial infarction.
- Patients post-percutaneous coronary intervention (PCI) or coronary artery bypass grafting (CABG) during subacute follow-up.
- Frail older adults with multiple cardiac risk factors.
Clinically, ACIP is intended as a continuously updating estimate of the probability that a high-risk patient will enter an acutely unstable cardiac state, warranting urgent clinical reassessment, in the next 24–48 hours. It complements, but does not replace, guideline-mandated diagnostics such as 12-lead ECG, troponin testing, or cardiology review.
Physio Rehab
This predictor introduces machine learning into the domain of physiotherapy and rehabilitation.
The rehabilitation market currently focuses on remote or digital exercise programmes and adherence tracking. Rehab Twin offers predictive analytics and patient specific precision.
Using a wearable continuous vital-sign monitor, this predictor couples real-time data streaming with personalised adaptive learning. Each individual recovering from injury benefits from a digital twin comprised of a continuously learning computational model that predicts short-term physiological change and guides intervention.
This predictor uses an individually personalised adaptive learning approach, dynamically calibrating baselines for each individual and learning how each person reacts to stress, load, and recovery. This establishes a high-fidelity connection between physiology, environment, and action.
Unique predictors address priorities in rehabilitation medicine and physiotherapy for reliable predictive analytics to track the rehabilitative recovery trajectory at an individual level. This predictor uses four signal indicators and predictors to support clinical interventions.
This predictor enables rehab doctors and physiotherapists to predict recovery trajectories, optimise exercise load, and prevent reinjury by using (HR-power ratio) continuous physiological data and digital-twin simulations. It can be applied broadly in post-operative orthopaedic rehabilitation (e.g., total knee or hip replacement), neurological recovery (post-stroke motor rehabilitation) and chronic musculoskeletal disorders (e.g., low-back pain, tendonopathies).
The clinical dashboard displays unique indicators to track the rehabilitation trajectory and take corrective action in advance of emergent exacerbations.
The four rehabilitation metrics are defined uniquely through machine learning.While similar ideas appear in physiotherapy assessment and HRV analysis, these indices represent composite measures combining digital twin simulation and continuous physiological monitoring. They provide predictive rather than descriptive analytics but whichare not yet standardised across the rehabilitation industry.
- Recovery Efficiency Index (REI): ratio of observed to expected recovery gradient
- Re-injury Probability (RP): likelihood of strain or compensatory pattern emergence within 48 hours.
- Exercise Adherence Index (EAI): compares motion-derived exercise compliance to prescribed regimens.
- Autonomic Stress Index (ASI): derived from HRV and galvanic proxies; detects over-exertion or inadequate rest.
The dashboard provides green-amber-red recovery states with trend-lines. Adaptive algorithms suggest exercise modifications (intensity, duration, rest intervals). And alerts are triggered when predicted recovery delay varies more than 15 % from baseline trajectory.
From a practical approach, the goal is to target a 20 to 30% reduction in average rehabilitation duration with reduced therapist time per patient through objective remote monitoring and lower readmission and re-injury rates.
Physio Elite (Sport Twin)
This predictor introduces machine learning into the domain of physiotherapy and sports medicine.
The elite sports analytics market focuses on historical data and general fatigue scoring. Sport Twin introduces forward-looking, simulation-driven analytics, offering athlete specific performance predictive insight.
Using a wearable continuous vital-sign monitor, Sport Twin couples real-time data streaming with personalised adaptive learning. Each individual, focused on optimising athletic output, benefits from a digital twin comprised of a continuously learning computational model that predicts short-term physiological change and guides intervention.
Sport Twin uses an individually personalised adaptive learning approach, dynamically calibrating baselines for each individual and learning how the body reacts to stress, load, and recovery. This establishes a high-fidelity connection between physiology, environment, and action.
The sports predictor addresses the priorities of tracking changes in elite performance to optimise the training plan on an individualised basis. The predictor uses three signal indicators and predictors to support training and coaching objectives.
This predictor is designed to enable elite athlete trainers, coaches and their clinical colleagues in sports medicine to optimise training load, predict fatigue, and personalise recovery strategies for professional and elite athletes by using continuous physiological data and digital-twin simulations. It has applications in endurance sports such as cycling, marathon running, triathlon, explosive power sports such as football, rugby, athletics and precision sports such as tennis, golf where micro-fatigue influences accuracy.
The dashboard displays unique indicators to track the training (HR-power ratio) trajectory, using vital signs data.
The three metrics are defined uniquely in Sport Twin. While similar constructs exist (e.g., WHOOP Readiness, HRV-based fatigue metrics), the metrics used here are proprietary composites and algorithms that integrate physiological data predictions. They are not yet established or standardised across the sports analytics industry.
- Performance Deviation Index (PDI): detects statistically significant dips in key metrics (VO₂ proxy, HR-power ratio).
- Fatigue-Injury Risk (FIR): probability of strain or overuse injury given training load.
- Readiness Score (RS): composite of recovery, sleep, and psychological indicators.
The advanced prediction functionality simulates what-if recovery protocols including massage, nutrition, or sleep and learns from longitudinal adaptation curves to forecast performance peaks and tapering points and uses reinforcement learning to fine-tune recommendations based on observed vs simulated outcomes.
The dashboard captures data for individuals and for teams, with fatigue mapping to enable benchmarking of individual performance monitoring within teams. It is intended to integrate through API with existing performance management products.
The focus is early detection of overtraining and injury risk, enhanced recovery efficiency and load accuracy, and competitive advantage through precision readiness forecasting.
Heat Related Deterioration
The Problem
The recent heatwave in Europe and elsewhere has produced thousands of excess deaths: UK about 2700 despite strong adaptation methods in an elderly population, Germany about 5500 showing how a fragmented response system between federal and state levels can cause death, and France at about 2000 also despite strong adaptation methods and also in an elderly population and overall across Europe over 10,000. What’s going wrong?
I suggest at least in terms of excess deaths from heat, the wrong problem is being solved very well because of the way heat waves are managed:
| Model type | What it predicts | Operational examples | Main limitation |
|---|---|---|---|
| Meteorological heat warning | Whether forecast heat will exceed hazardous thresholds | France: Météo-France; Germany: DWD | Predicts environmental hazard, not health outcome |
| Heat–health impact warning | Expected pressure on mortality, healthcare and vulnerable populations | France’s SACS; UKHSA Heat-Health Alerts | Usually regional and categorical |
| Epidemiological mortality model | Expected excess deaths associated with temperature | European multi-country distributed-lag models | Often retrospective or research-based |
| Vulnerability mapping | Which neighbourhoods or population groups are most exposed | Age, deprivation, urban heat island, housing | Identifies groups, not individuals |
| Physiological heat-strain model | Core-temperature or heat-strain response | Occupational and military models | Designed mainly for healthy workers |
| Individual machine-learning model | Heat stress or thermal discomfort from wearable and environmental data | Small experimental and occupational studies | Rarely validated for older, frail clinical populations |
None of this tells us if a particular person is likely die from heat in the next 24 to 48 hours. The current epidemiological approach is called distributed lag non-linear modelling, DLNM [Gasparrini A, Armstrong B, Kenward MG. Distributed lag non-linear models. Statistics in Medicine. 2010 Sep 20;29(21):2224–34.] and is suitable for population risk but not for individuals. The methodology estimates:
- the non-linear relationship between temperature and mortality;
- the delay between heat exposure and death;
- the locally specific minimum-mortality temperature;
- attributable deaths above that temperature;
- variation by age, sex and location.
While this tell us whether an area will experience dangerous heat, it isn’t what we want to know (i.e. solves the wrong problem).
What we really want to know is this:
What is a specific person’s probability of heat-related deterioration, hospital admission or death during the next 24 to 48 hours?
Machine learning is now seen as the way forward [e,g, You J, Chan JH, Stouffs R, Gottkehaskamp BG, Miller C. Evaluating heat exposure and vulnerability among older adults using wearable technology to support aging in place. IOP Conf Ser: Earth Environ Sci. 2026 Feb 1;1582(1):012052. doi:10.1088/1755-1315/1582/1/012052]
In keeping with my approach to decision making in clinical settings, we need a predictor to combine environmental exposure, personalised baseline data, dynamic physiological vital signs data and heat risk increasing drugs (HRIDs). All of these exist but not as a solution: all that is needed is to put the parts together.
Let’s begin with the risk factors that affect individual risk from heat, which the current problem approach doesn’t do:
| Risk domain | Examples |
|---|---|
| Age | ≥65 years, particularly ≥75 years |
| Frailty | Frailty scales, reduced mobility, dependence for daily activities |
| Chronic disease | Heart failure, coronary disease, COPD, chronic kidney disease, diabetes, dementia |
| Medications | Diuretics, anticholinergics, antipsychotics, antidepressants, sedatives, beta-blockers, ACE inhibitors/ARBs in some circumstances |
| Functional status | Unable to obtain fluids independently, bed-bound, cognitive impairment |
| Previous history | Previous heat illness or dehydration |
| Social factors | Living alone, no air conditioning, poor housing, social isolation |
| Environmental exposure | Top-floor accommodation, urban heat island, prolonged outdoor exposure |
The Solution
In keeping with my approach of solving the right problem, we start by acknowledging that the current approach is adequate for population level heat risk, but is not suitable for assessing individual risk to avoid excess deaths from heat.
My solution brings together three important features:
1. a way for individuals and informal carers to assess personal heat risk
2. a tool for clinicians to assess heat risk in clinical and institutional settings
3. a way to capture the risk caused by medicines.
Let’s start with number 3: HRIDs: heat risk increasing drugs.
| HRID mechanism | Important examples | Potential heat interaction |
|---|---|---|
| Fluid loss or reduced circulating volume | Loop and thiazide diuretics; laxatives; SGLT2 inhibitors | Dehydration, electrolyte disturbance, hypotension |
| Renal vulnerability during dehydration | ACE inhibitors, ARBs, ARNIs, NSAIDs, diuretics | Acute kidney injury, particularly in combinations |
| Reduced sweating or impaired heat dissipation | Anticholinergics; some antihistamines; tricyclic antidepressants; some antipsychotics; topiramate, zonisamide | Reduced ability to cool through sweating |
| Central thermoregulation effects | Antipsychotics, stimulants, some antidepressants | Altered hypothalamic regulation or heat production |
| Hypotension or limited cardiovascular compensation | Antihypertensives, nitrates, beta-blockers, diuretics | Dizziness, syncope, inability to increase cardiac output appropriately |
| Reduced alertness or self-care | Benzodiazepines, hypnotics, opioids, sedating antipsychotics and antihistamines | Failure to drink, move to a cooler place or recognise deterioration |
| Narrow therapeutic index affected by dehydration | Lithium, digoxin and some anti-epileptics | Toxicity as renal clearance, fluid balance or electrolytes change |
| Glucose-management vulnerability | Insulin, sulfonylureas, SGLT2 inhibitors | Hypoglycaemia, hyperglycaemia or dehydration-related instability |
| Potentially harmful self-treatment | NSAIDs, aspirin and paracetamol often used to “treat” heatstroke | May add renal, dehydration or hepatic risk and do not treat the underlying heat emergency |
Since mortality is highest amongst the elderly, many of whom are frail and prescribed a variety of medicines (polypharmacy), this is an important feature to capture in the prediction model.
The other two are assessments for self and for others and of course they need validation. If you want to see them, email me.
To illustrate the solution, below is an HTML simulator. I did this in English, French and German, so relevant authorities and interested parties can assess it easily. Feel free to explore the functionality.
Lyme Disease Red Flag
The red-flag decision tool is intended to support early clinical reasoning where Lyme Disease may be unfamiliar. It does not diagnose infection, but helps identify patterns requiring escalation, further assessment, or alternative diagnostic consideration.
West Nile Virus Red Flag
The red-flag decision tool is intended to support early clinical reasoning where West Nile virus or related viral syndromes may be unfamiliar. It does not diagnose infection, but helps identify patterns requiring escalation, further assessment, or alternative diagnostic consideration.
Arboviral Red Flag
The red-flag decision tool is intended to support early clinical reasoning where aboreal neuroinfectious disease are present and may be unfamiliar. It does not diagnose infection, but helps identify patterns requiring escalation, further assessment, or alternative diagnostic consideration.